Background
Some years ago, I needed an implementation of control charts (Statistical Process Control or SPC charts) in TypeScript. I ended up building it myself. It eventually became quite a popular add-on for a BI tool.
Building it took a couple of months as designing the API, implementing the charts and plotting, and identifying all the needed user settings required lots of trial and error.
A few weeks ago, I needed control charts again. This time in Python.
There are several open-source control charts implementations available for Python. But none of them had the features I needed. Control charts are surprisingly easy to implement incorrectly. It is not uncommon to find even popular libraries calculating the limits in a wrong way.
So I started to think about how much effort it would take to port my TypeScript library to Python.
No matter how I looked at the problem, the conclusion was the same: too much work. As it was a personal side project which would be done in my free time, I simply didn’t have the time needed.
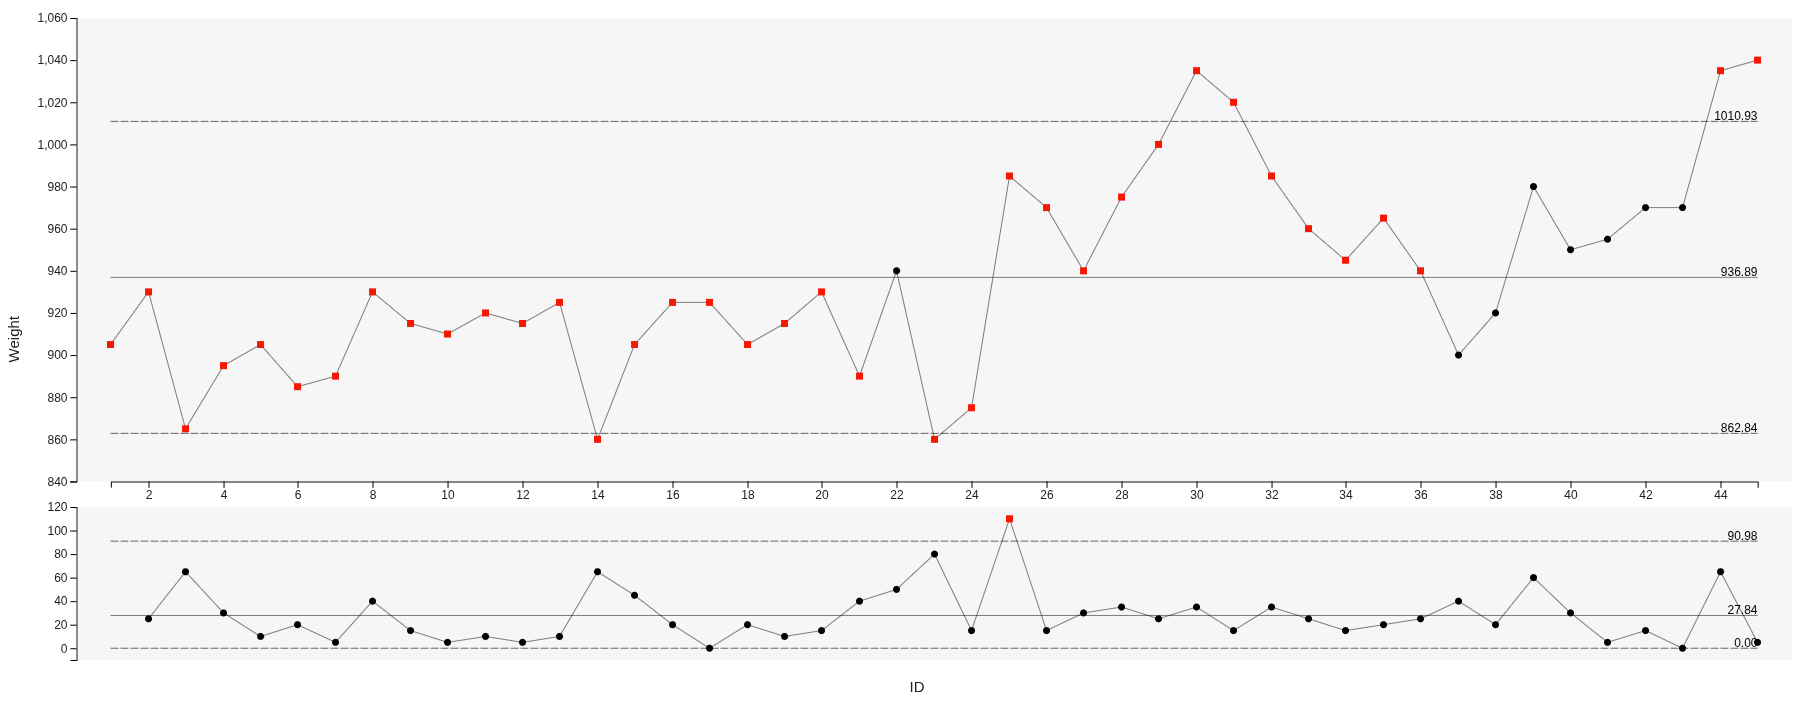 XmR chart plotted with the TypeScript library
AI-Assisted Coding - Part 1
By the end of the last year, there were more and more stories about AI-assisted coding. How the latest models were game changers.
I had tried these kinds of tool before but my experience was that they were useful for small tasks and struggled with larger codebases. The TypeScript library has roughly 10,000 lines of code, making it a medium-sized project. This made me a bit skeptical.
Four weeks ago, I decided to give a proper test. I bought a Cursor Pro subscription and dug in.
The first attempt was straightforward: I asked it to port the code.
You are an expert programmer fluent with typescript and python. You port typescript code to python and create simple, pythonic code. You create simple but powerful function signatures.
in @typescript_lib folder, there is a typescript implementation of statistical process charts (SPC) calculations. Your job is to port it to python. Example interfaces for the calculation function you will find from the @tests/test_imr_chart.py file.
Use pandas api and its functions, otherwise keep dependencies minimum. If there is an elegant way to implement some required functionality using external library, ask before using it.
Mandatory requirements: the calculations must be identical, all functionality must be implemented in the new version, all the tests must pass, the new code must be pythonic, i.e. all the typescript idiosyncracies has to be replaced to python ones, the code must elegant and simple
Ask questions as long as you need and make sure you understand all the detail.
It chewed on the problem for a quite long time, but in the end it produced a working version of the library in Python. It wasn’t elegant and was definitely not maintainable, but it worked.
Using The Planning Mode
In the next attempt, we started by planning the solution together with the AI.
The session started like this (in verbatim, with errors and all):
You are an export [SIC :)] python programmer. You design elegant and pythonese apis.
Your task is to first design an api for SPC/Control Charts library. Library calculates the values for a separate charting library so that’s easy to plot the control chart visuals.
The library should not have any external dependencies unless it’s absolutely required or makes perfect sense. The libraries used must the main stream, common, and supported.
The library needs to have separate functions to create diffent kinds of control chart objects (function will return these, they will contain the observations, labels, groups, ucls, lcls, usls, lsls, etc). The functions should have as similar apis as possible. The api must be as easy and intuitive as possible.
Here’s a sketch of the input and output data objects. Review and make suggestions how to turn it into native python api and easier to use.
Ask questions as long as everything is clear. Do not cut corners.
"""
Data models for control charts.

This module defines the data structures used throughout the pycontrolcharts package.
All models use Python dataclasses for clean, type-safe data structures.
"""

from dataclasses import dataclass, field
from enum import IntEnum
from typing import Optional, List, Union

class RunType(IntEnum):
    """
    Types of run test violations.

    Based on Western Electric and Nelson run test rules.
[…]
It took several hours of back and forth. I provided examples of code, answered a multitude of questions, and when the plan was finally ready, we had created almost a megabyte of chatlogs and markdown. Before the implementation started we had a detailed implementation plan.
This made all the difference. After the second round I had a solid library in my hands.
I used the TypeScript library to validate the result of the Python implementation. The charts differed in a couple of tests. Funnily, one of the run test implementations in the original code did not detect one of the edge cases. I had no idea about this bug, but the AI had fixed it while porting the code. Deliberately or not, I don’t know.
The code required some manual touches. Some parts of the plotting were not good, for example padding around the chart. No matter how I tried, it just didn’t get it right but kept on suggesting more and more complex solutions. The complex run tests were implemented as a state machine. This logic was too complex for the AI.
My Findings
In the end, I was blown away by how amazingly helpful these tools have become.
Productivity
- Substantial acceleration. My rough estimate is that development was 5–10x faster compared to writing everything manually.
- Faster learning. Discovering “pythonic” approaches was effortless. The feedback loop was immediate.
Quality
- Code quality is reasonable. Especially in repetitive or boilerplate code, the output was often cleaner than what I would have written initially.
- Improved documentation. The AI consistently generated more comprehensive documentation than I typically would for a side project.
Limits
- AI struggles with difficult code. The model struggled with complex layouts and the non-trivial state machine. I ended up implementing those parts manually.
- Good architecture and design do not emerge automatically. Without explicit guidance, the structure degrades quickly.
- Using AI well is a skill. It resembles mentoring a junior developer. Instructions must be precise. Feedback must be continuous.
Other benefits
- AI enables planning and revising easily. With AI tools, I would have implemented the first version, then realised a better way to do it, but at that point have no time nor energy to change it.
- Building stuff is fun again. For me, the joy is back to programming or should I say building. No need to remember all the nitty-gritty details as AI is pretty good with that.
- Your mileage will vary. This is not something everyone will enjoy. Personally, I get a kick out of building something new. If you love creating elegant code by hand, you might not enjoy AI-assisted coding.
Sometimes AI produced excellent code for a long stretch and then suddenly introduced subtle regressions. Occasionally it modified unrelated parts of the code. It can lull you into complacency to “git add .” if you are not vigilant.
AI is extremely good at mechanical translation and boilerplate, but still weak at architectural clarity and complex state logic.
What Does This Mean?
A few observations:
- AI-assisted coding can’t be ignored. It increases developer efficiency substantially.
- The tool development is extremely fast at the moment. It’s not easy to stay up-to-date.
- It’s a lever. Used well and it provides you good results fast. Used poorly and it creates an unmaintainable codebase even faster.
- It takes skill to use it and learning takes time.
- It’s an excellent tool for prototyping.
- It could be a huge asset for code migrations and give a new life to legacy codebases.
- With a proper feedback loop, it can provide better results than humans. For example in performance optimizations, AI can try out different solutions if it can do the performance comparisons by itself.
Introducing pyControlCharts
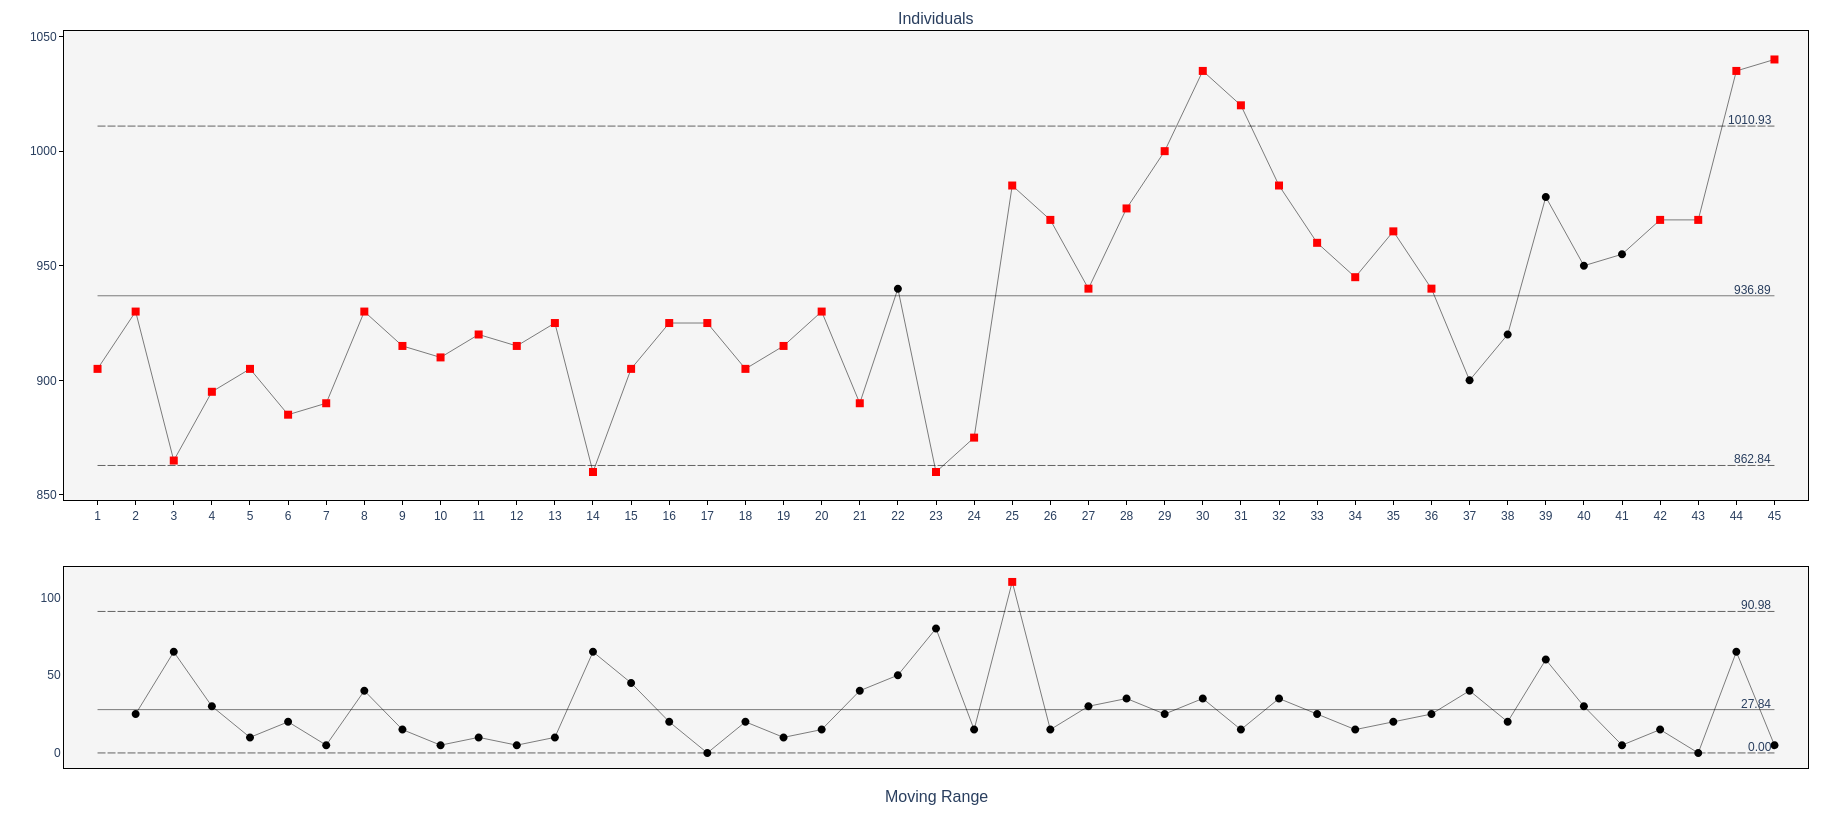 XmR chart plotted with pyControlCharts.
You can find the pyControlCharts library from Github or use it from pypi. It has all the major control charts along with the most important run tests. Most importantly, it provides the charts in both machine- and human-readable form. The charts are not just for human consumption but you can easily use them in data pipelines, AI models, and as an AI agent tool.
Control charts are fundamentally about separating signal from noise in variation. In an era where automated systems increasingly make decisions based on data, having that signal available in structured form matters more than ever.