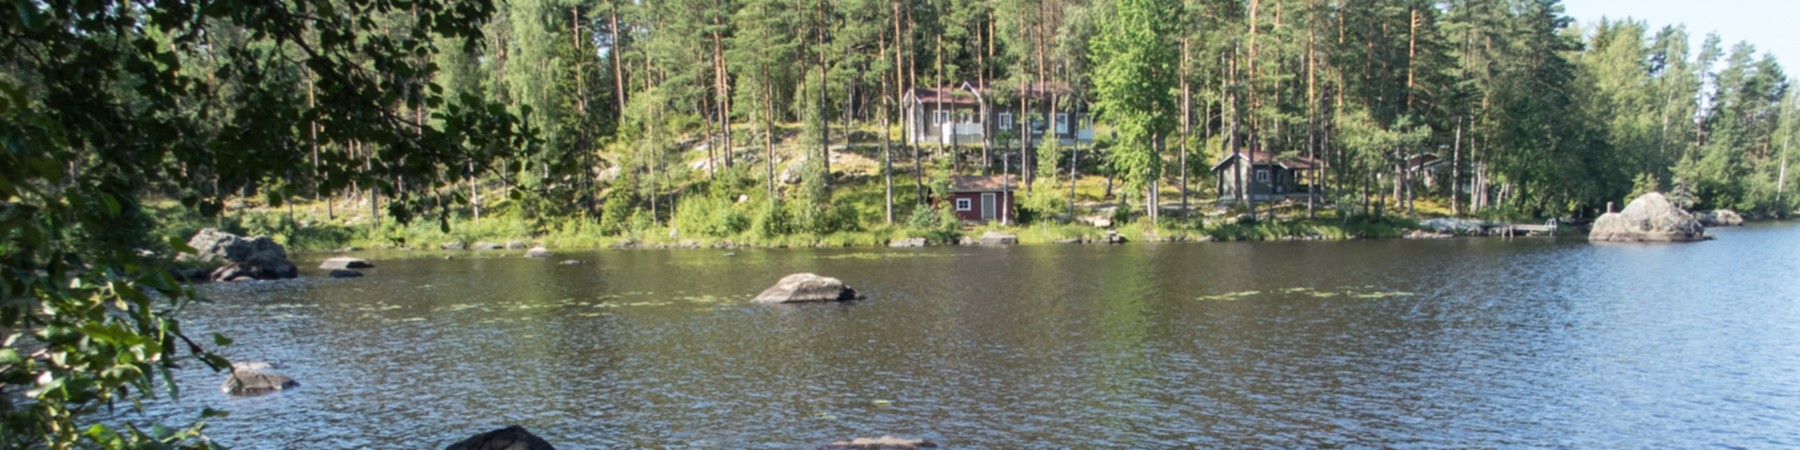
 A typical cabin setting in Central Finland. Image by Kotivalo, CC by 4.0
On Friday, the 5th of the October 2012, three young guys travelled some 350 kilometers to spend the weekend at a country house. The guys were old friends, but one of them, Jussi, had started to drift from the others in recent months. He had made new friends, and he was a bit wilder than the rest.
The driver, who had broken his foot recently, had a bit of a hard time driving the car, but he did it anyway as it was his father’s car. The country house they were going to belonged to his family. The guys had been there many times before, and they enjoyed being in the countryside.
The guys had set off from Riihimäki in the afternoon because they wanted to arrive at the country house before dark. It was raining, and the storm was blowing leaves onto the road, making it slippery. With winter approaching, temperatures were around +5C, and the days were getting shorter - the sun would set around 18:30 and would not come up until 7:30.
En route, some 60 km before their destination, they stopped at a petrol station to fill up the tank. The car was a new Citroën C5, with a powerful 3.0 liter engine, and almost 250 horsepower.
Once they got to the country house, they warmed up the place as the house was not used much during the colder months. Every Finnish country house has a sauna and they did what all young Finnish guys would do: they started drinking and heated up the sauna. The sauna was by the lake, some 100 meters from the country house.
Everything was going well until Jussi called his ex-girlfriend, who he had an on/off-relationship. At that time she was living in Tikkakoski, a small town some 40 kilometers from the cabin. Soon, the call turned in to a fight which just kept going. Jussi started to get emotional, and started shouting into the phone.
The other two decided to go to the sauna instead of having to unwillingly listen to the call. When they left, Jussi silently mouthed “I’ll join you shortly.”.
It is easy to lose track of time when you are having a few autumn beers in a sauna. After some time had passed, the two guys realized that Jussi still hadn’t joined them. They went to see what was going on at the house.
When they got there, Jussi was gone. And so too was the car.
While searching around the house, the guys noticed that while Jussi had left his wallet, passport, keys, and all his other belongings. What was missing was Jussi, his phone, the car, and a bottle of liquor from the freezer.
At that point the guys really started to worry. It was pitch black outside. The rain had stopped a while ago, but was starting again. In the yard, you could see a dry spot, where the car had been, slowly getting wet.
They tried calling him but his phone was turned off.
The guys did their best to find him. They followed the tracks on the dirt road and saw the tracks entering the main asphalt road. That was all they could find. Eventually they called the police.
The police got their call early in the morning at 4:48. They started the search immediately. As they had a reason to believe that Jussi’s life was in danger, the law allowed them to emergency locate Jussi’s phone. In emergency locationing the cell phone operator returns the last known location of a cell phone. The last location of Jussi’s phone was in the vicinity of the country house.
The police arrived at the country house and started their search. Several patrol vehicles drove around the nearby roads but came up with nothing. The police thought that Jussi had driven off somewhere to cool off, and that he would return later in the day.
The two guys at the cabin informed Jussi’s family, who started to get really worried. No matter what Jussi had done and how they had argued, he had always let them know he’s ok. But now, nothing. And the phone was off.
The next week, Jussi’s family submitted an official missing person report to the police.
Quite soon after the disappearance, a witness told the police that they had seen a young guy with a black car some 10 kilometers west from the cabin, in a town called Saarijärvi. The sighting was made on Saturday between morning and noon, several hours after Jussi had left the cabin. Police took this sighting seriously and deemed it credible.
As Jussi didn’t return, nor was found, the police thought hunters would stumble across the car during the hunting season. Winter came and went, but there was no sign of him.
The problem the police had was that Jussi knew the area well as he had visited the country house many times before. There wasn’t any indication where he had gone. It meant he could be anywhere. There are vast amout of lakes and hundreds of forest roads in that area and the car’s gas tank was full, which meant it had more than a 1.000 km range.
The search for Jussi continued for years after his disappearance. The local police said the case was discussed on a weekly basis. The National Investigation Bureau of Finland (KRP) took their turn investigating the case but couldn’t find anything.
As time went by, unsubstantiated rumours started to circulate as they always do in these kinds of cases. “He has gone to Lapland”, “he’s in the French Foreign Legion”, “it was a drug deal that went sour”, and “there was a fight at the cabin and he was killed”.
For the next nine years, there was no sign of Jussi. It was as if he had disappeared from the face of the earth.
]]>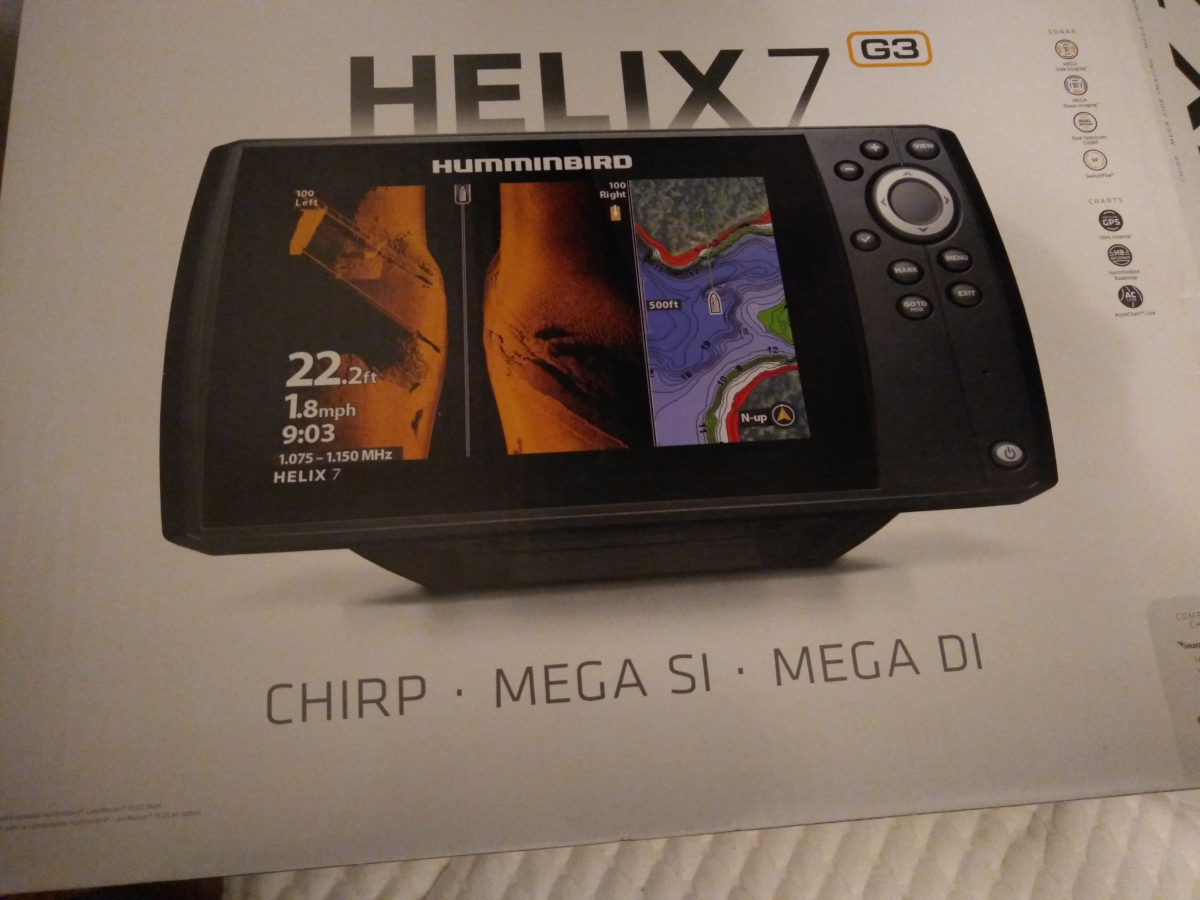 Sonar waiting for unpacking.
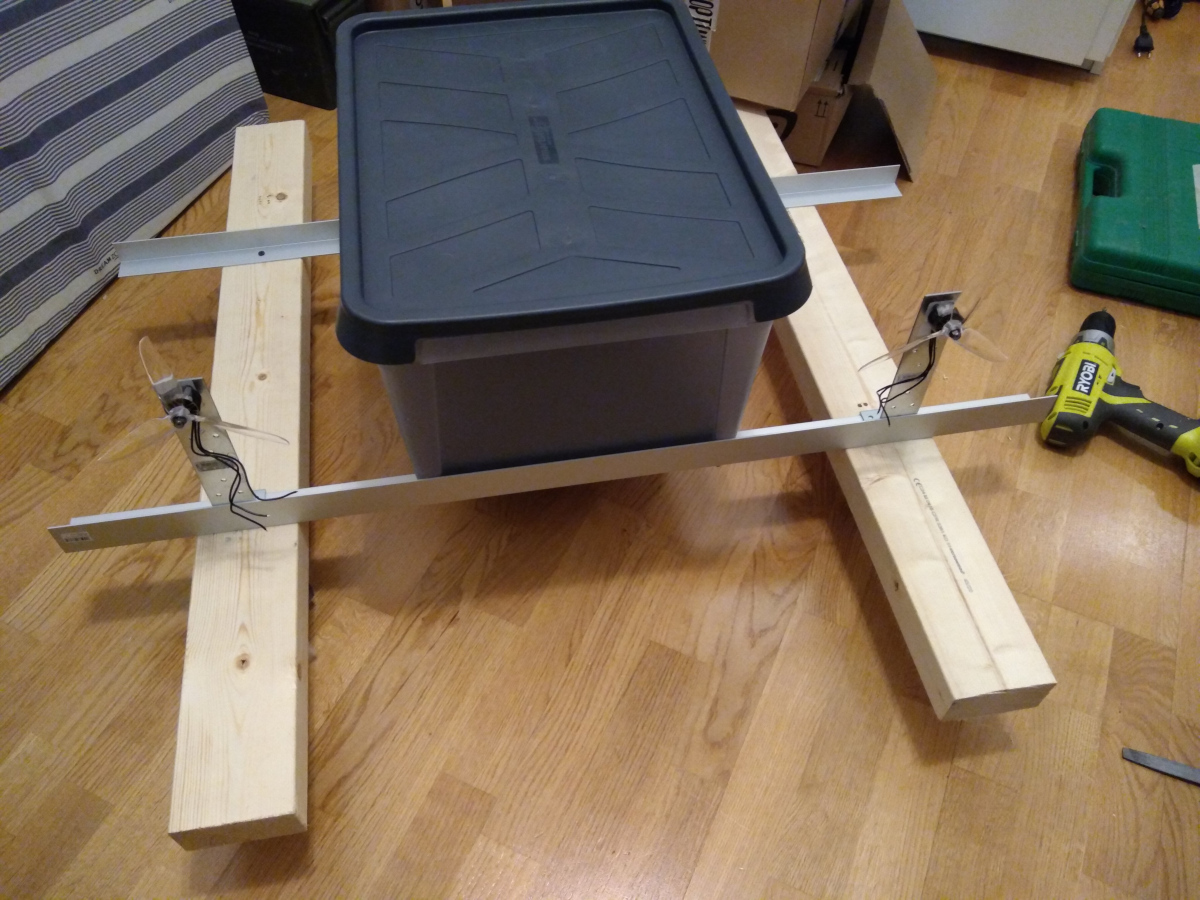 A modest beginning.
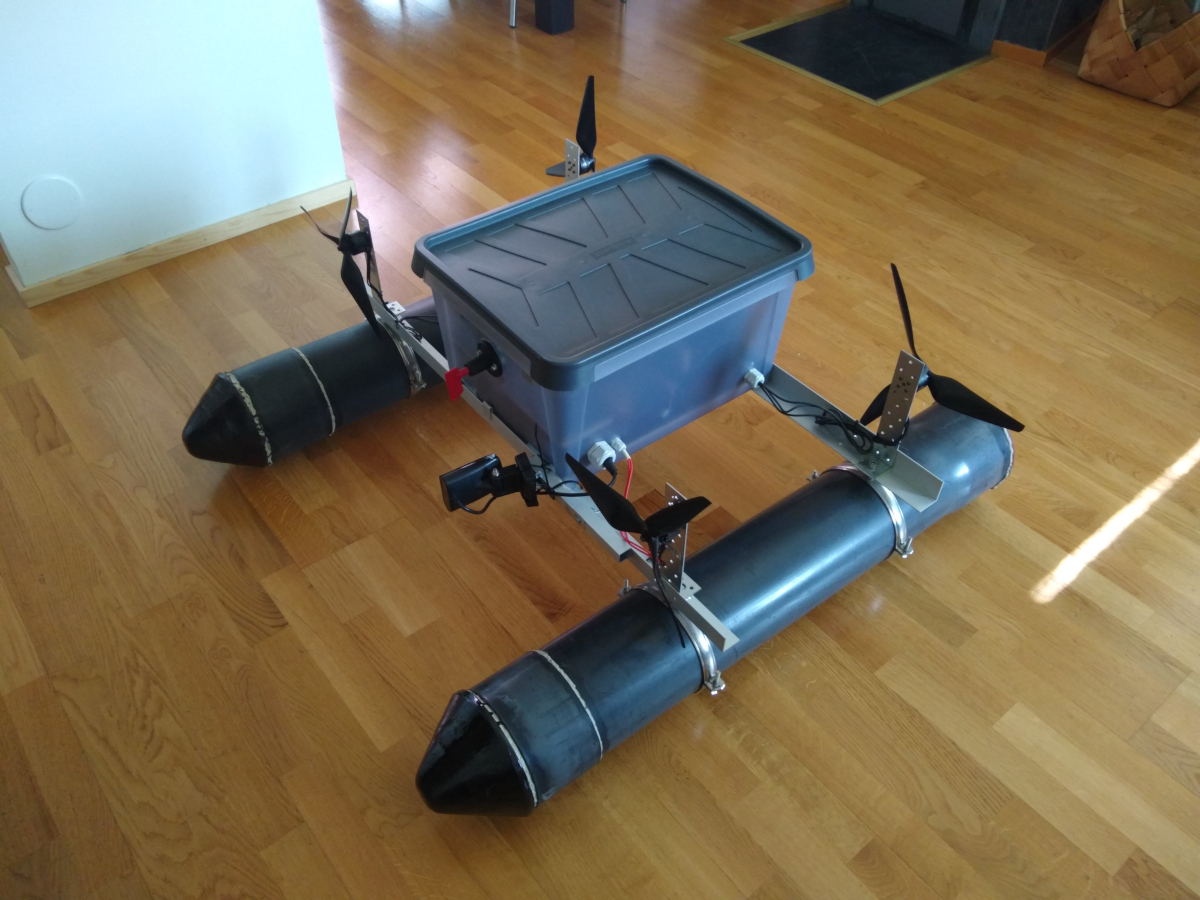 The RC-Boat in in it’s final form.
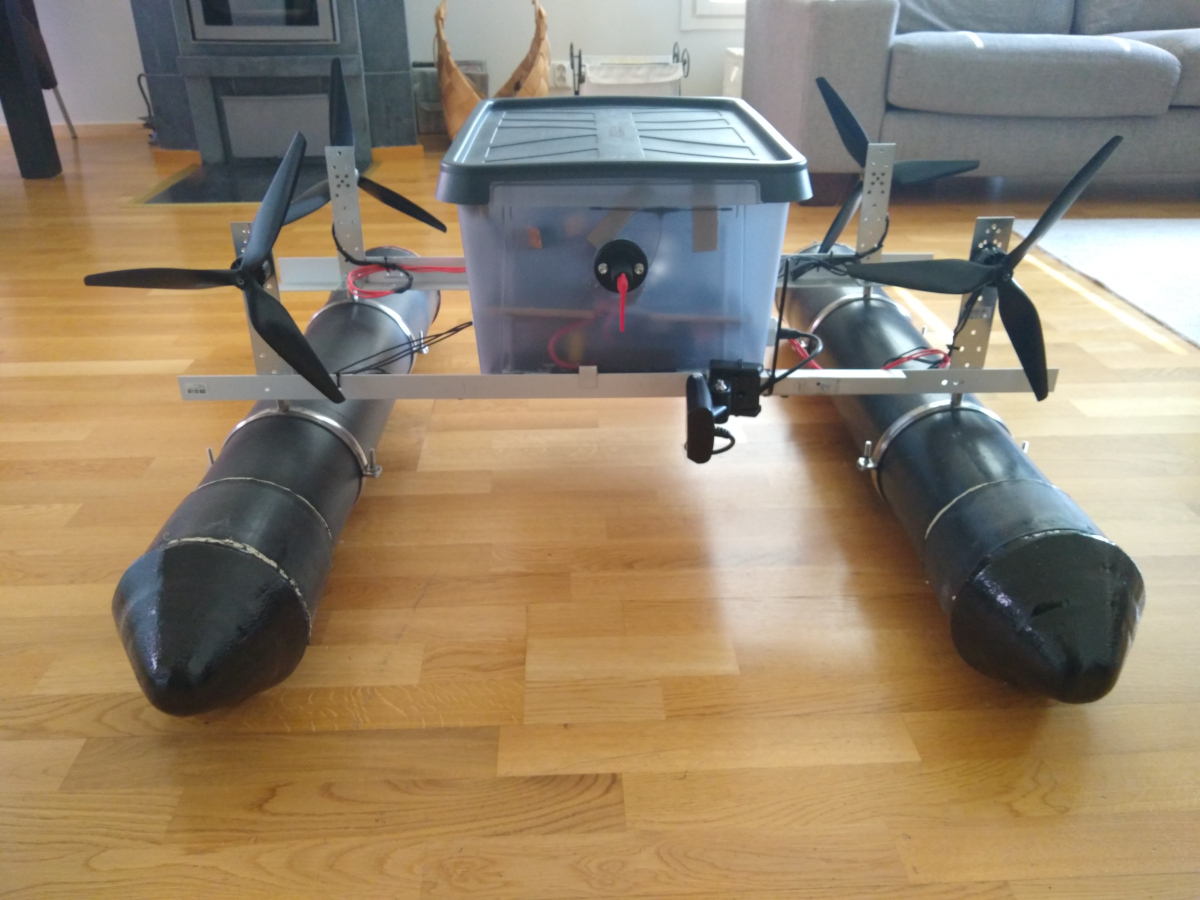 The transducer is stowed for transport.
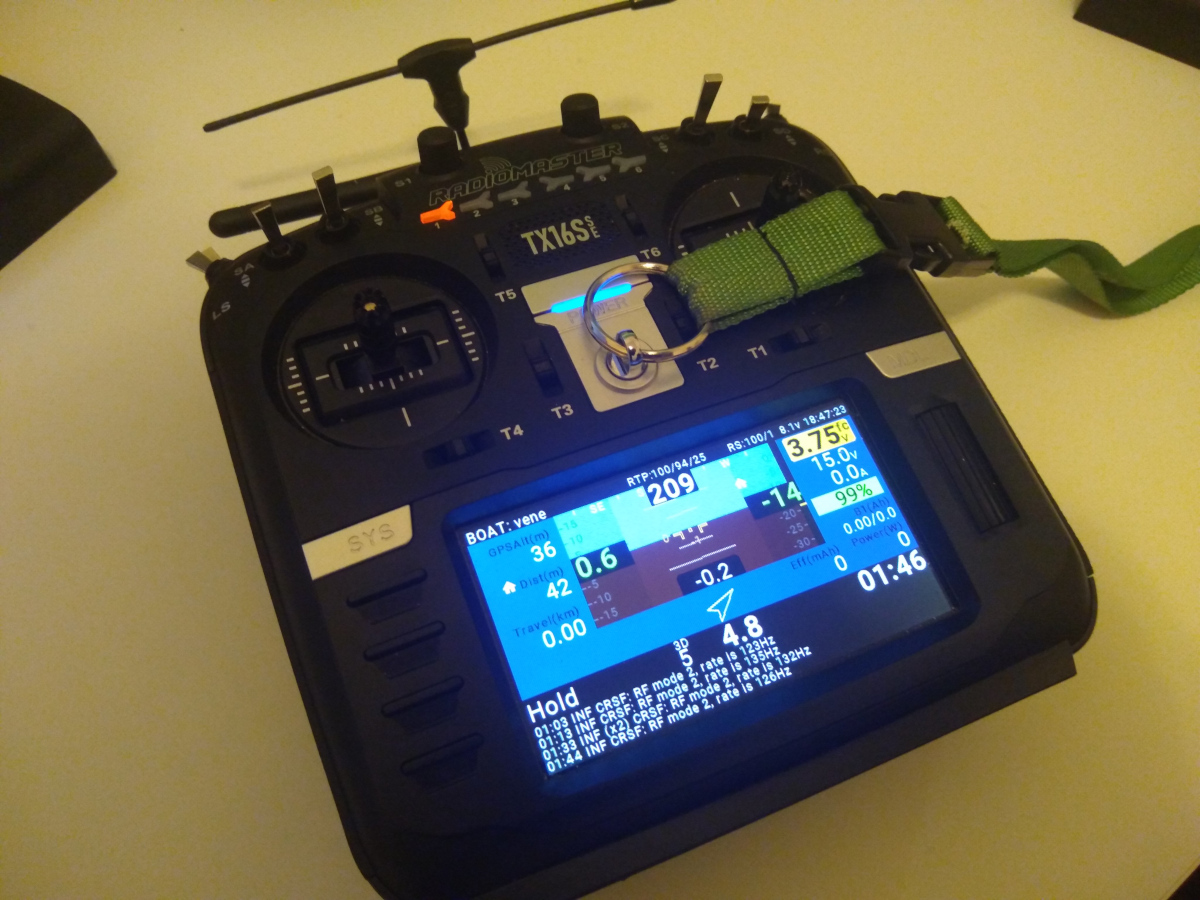 The remote control.
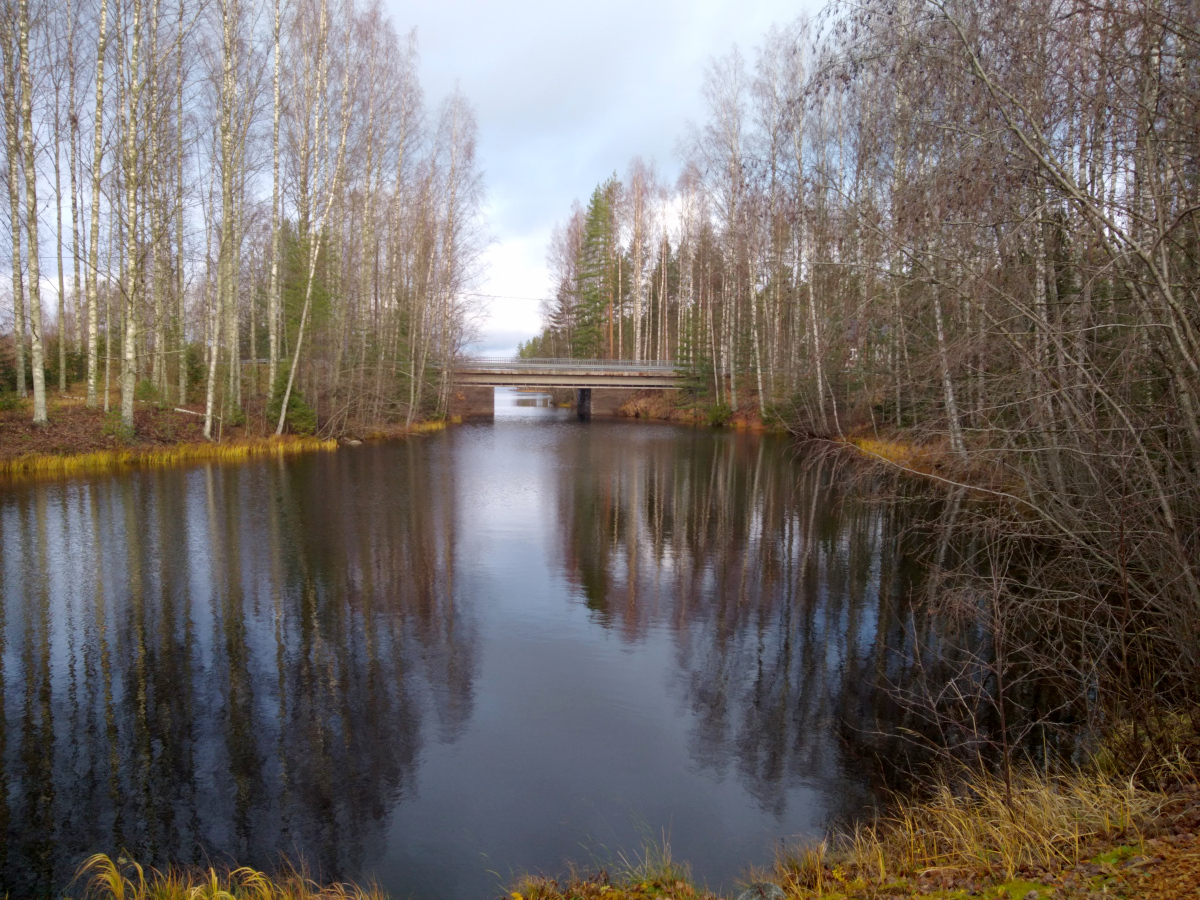 The canal seen from the dam.
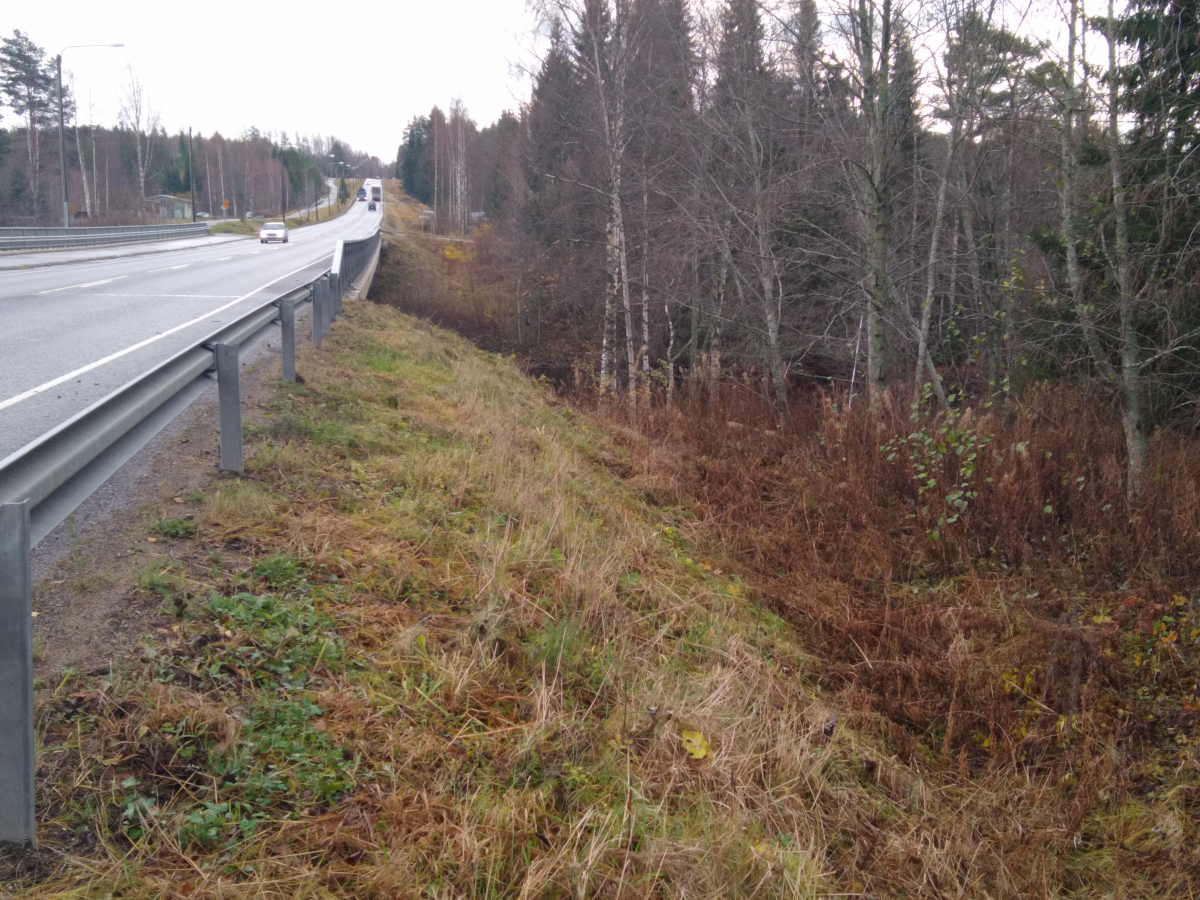 The river and bridge seen from the suspected route.
 The ROV camera and light cases came from a CNC shop in Poland.
 The dry hull (ie. the electronics container) first fitted to the wet hull (ie. the frame).
 The tether in the works.
 The mess was getting out of hand.
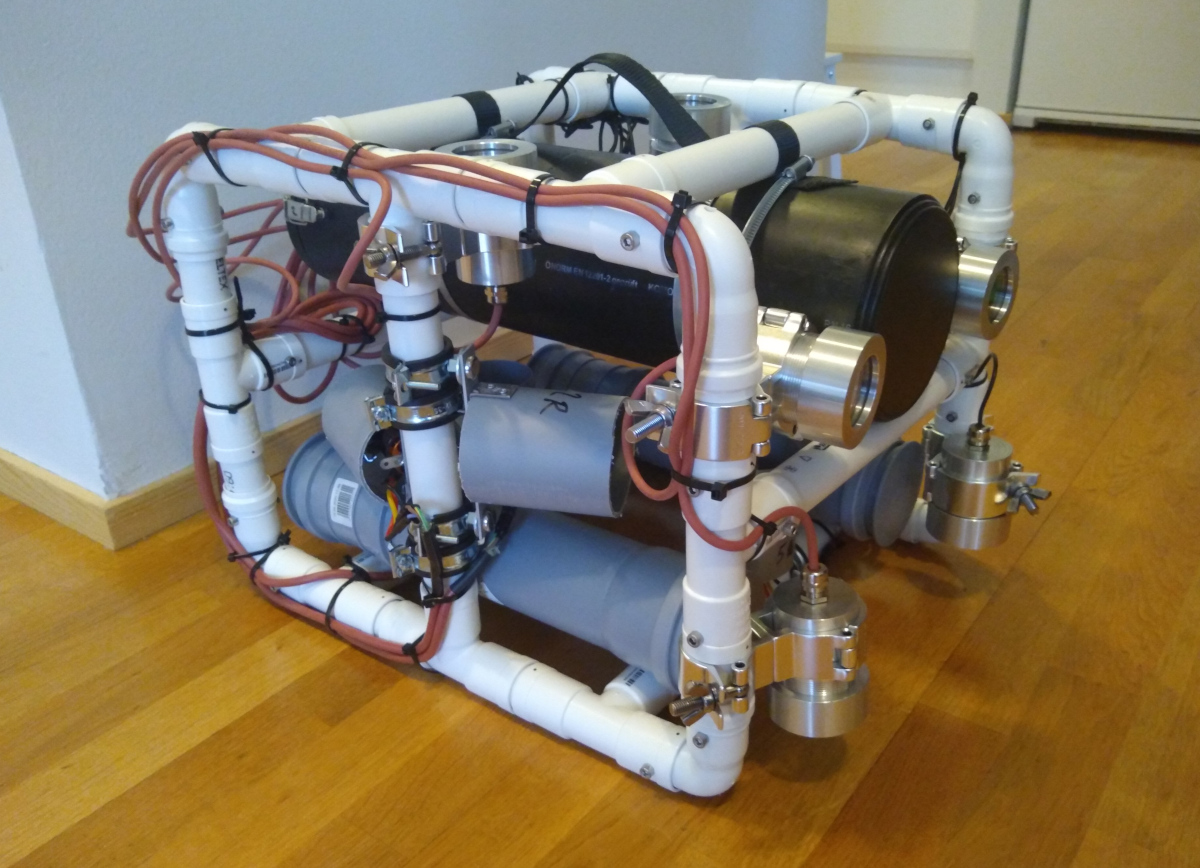 Almost ready to go. Missing the pontoons from the top and adjustable weights from the bottom.
There are 6 cables for the engines, 3 for the cameras, 3 for the lights, 1 for the network, and 1 for the sensors.
Almost ready to go. Missing the pontoons from the top and adjustable weights from the bottom.
There are 6 cables for the engines, 3 for the cameras, 3 for the lights, 1 for the network, and 1 for the sensors.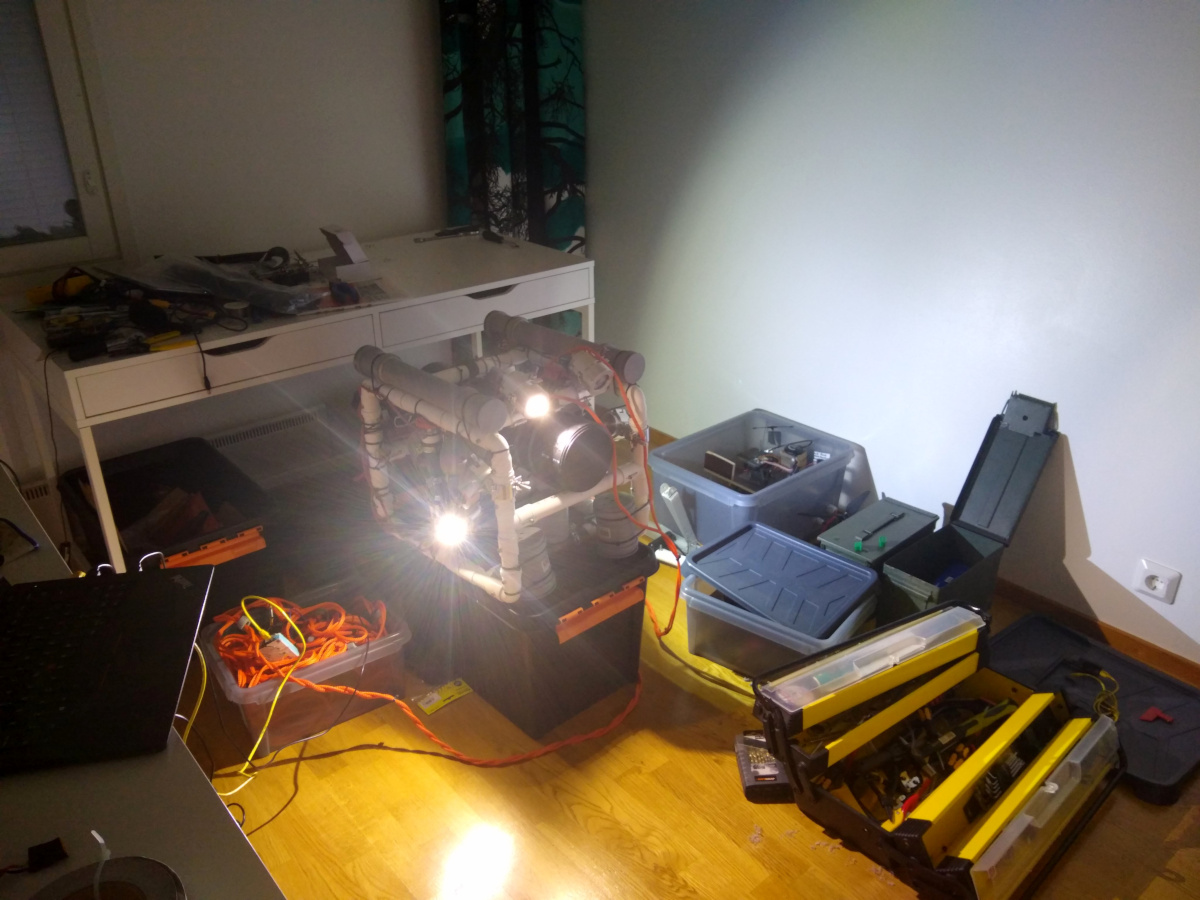 The finished ROV in the study.
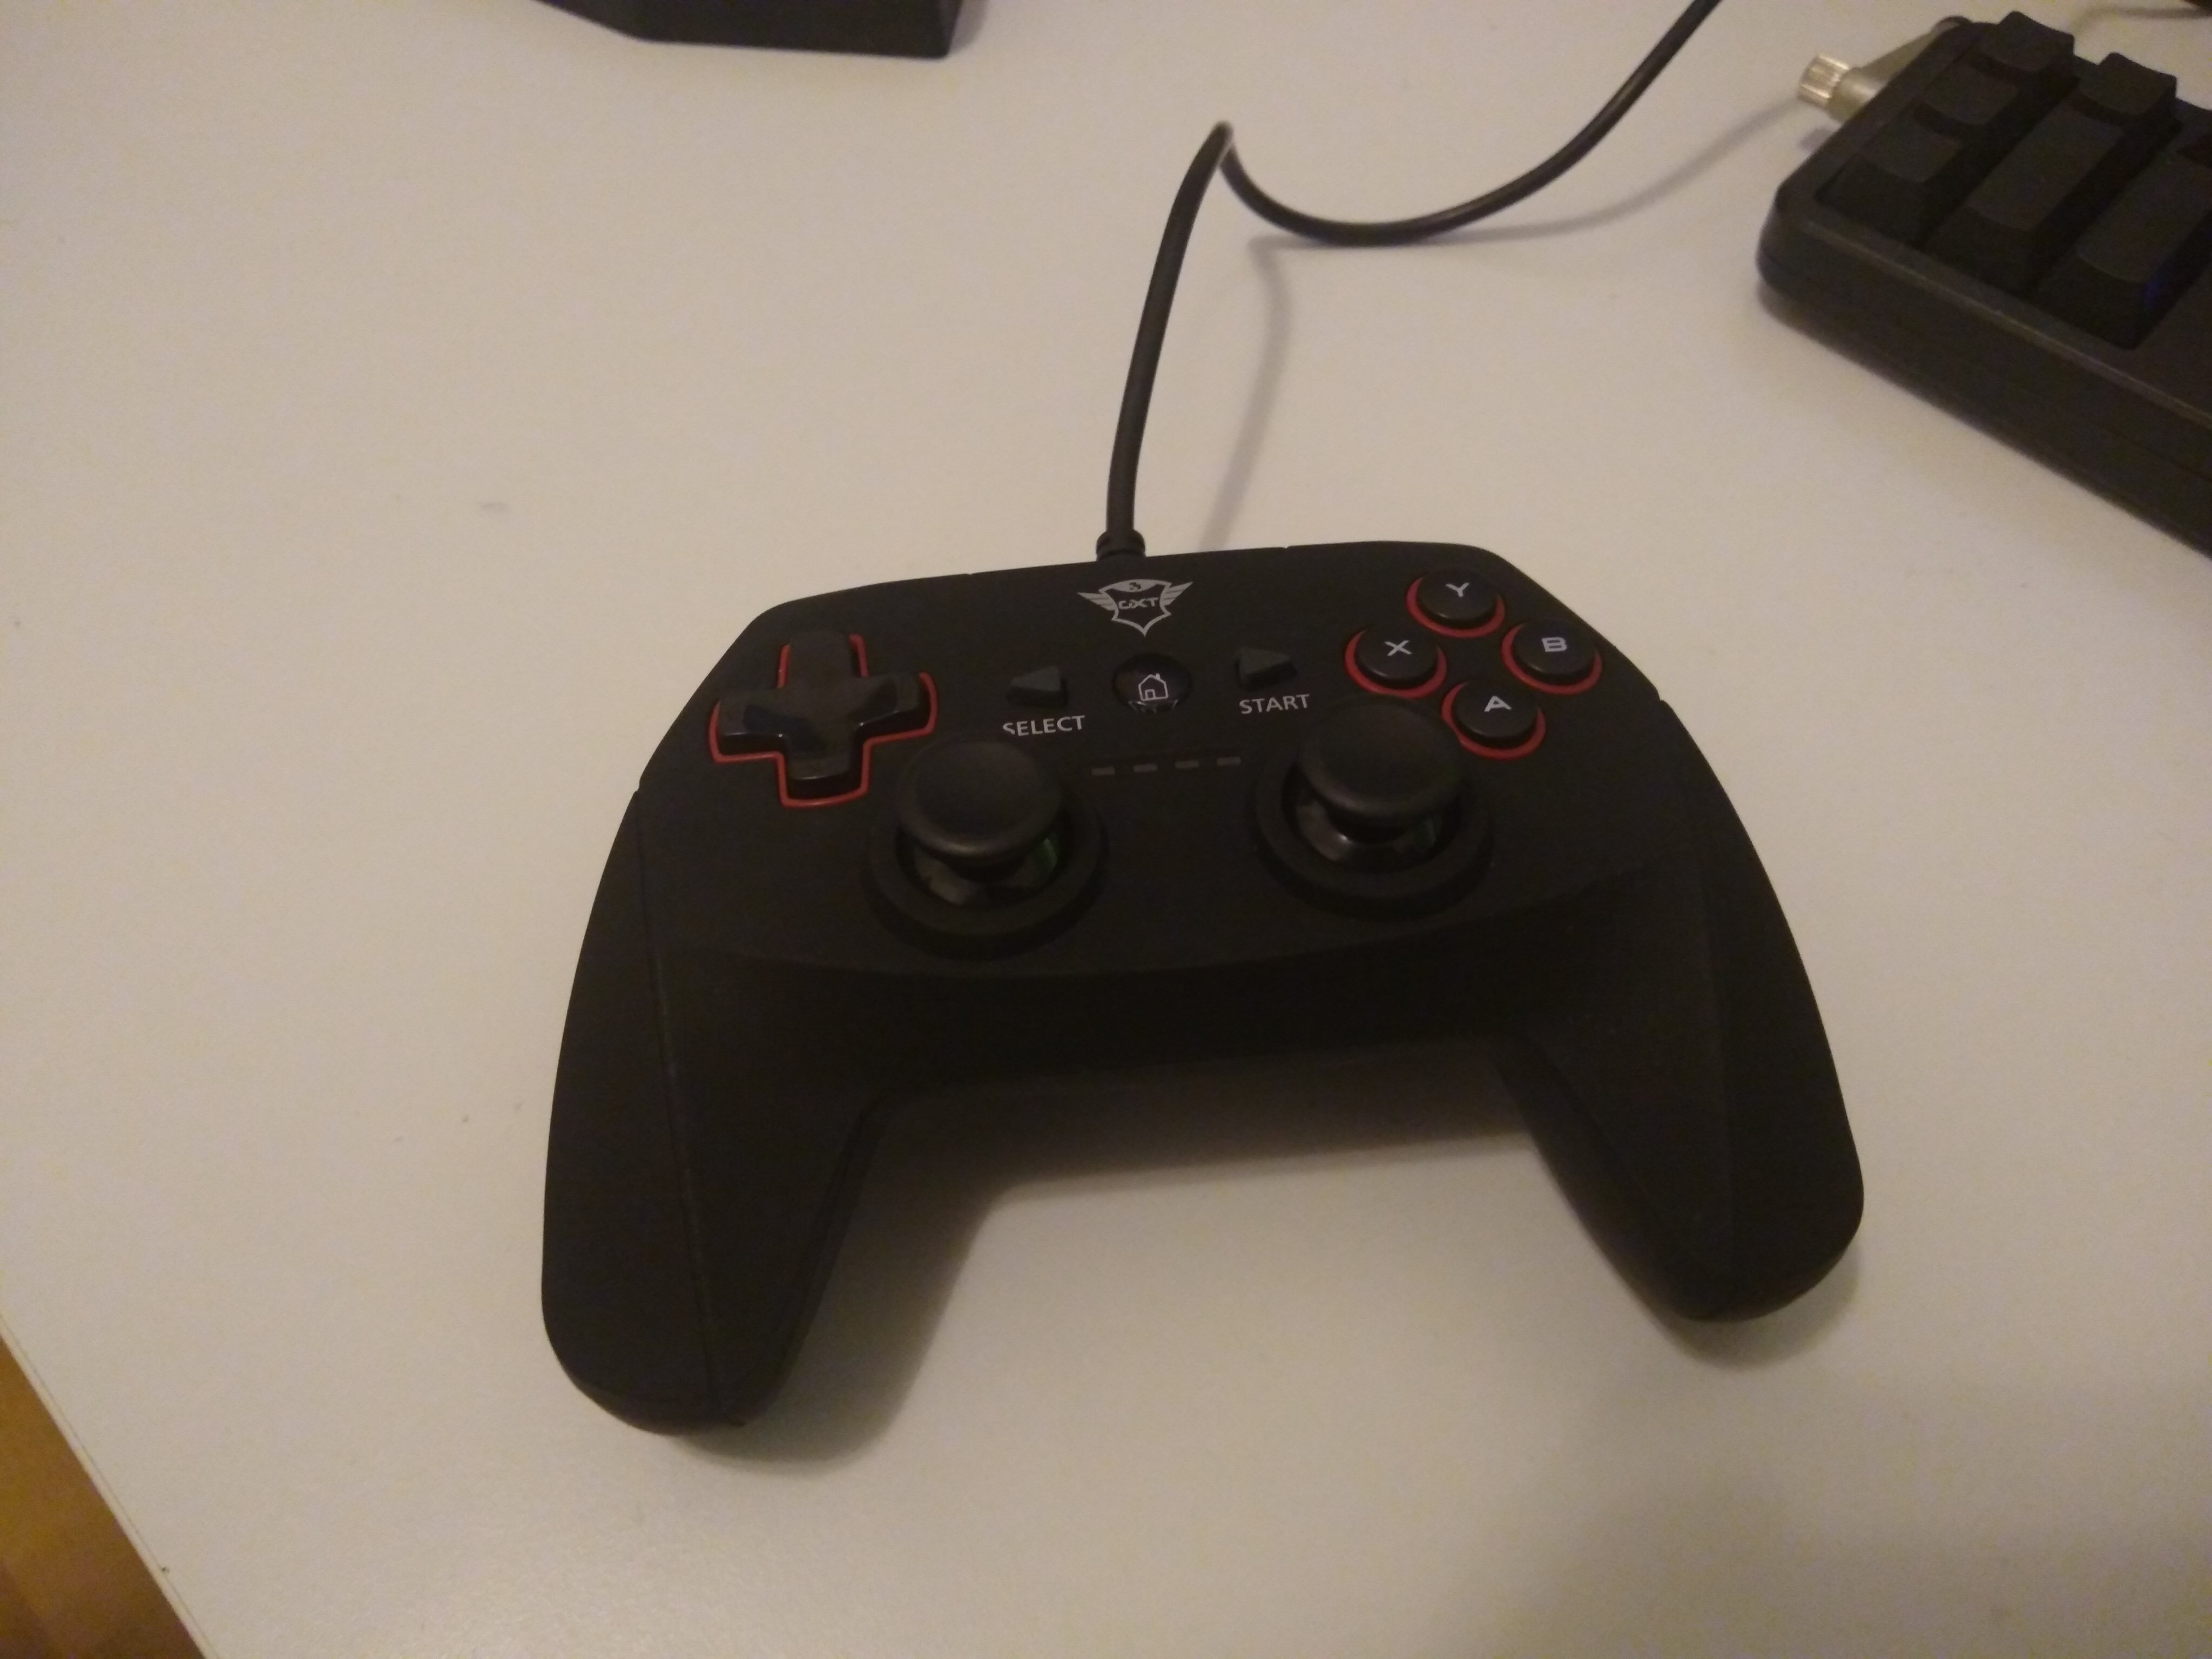 The first controller used. This model didn’t have a long enough range on the analog sticks, which made moving the ROV jerky.
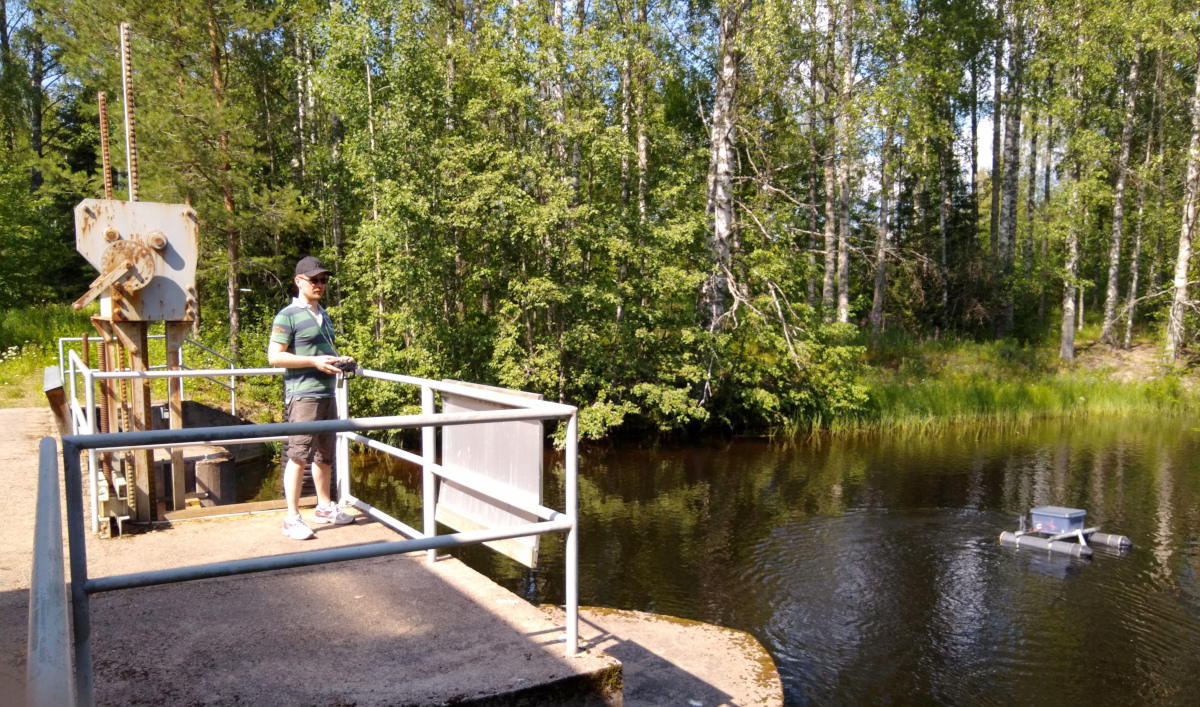 Piloting the RC-boat from the dam.
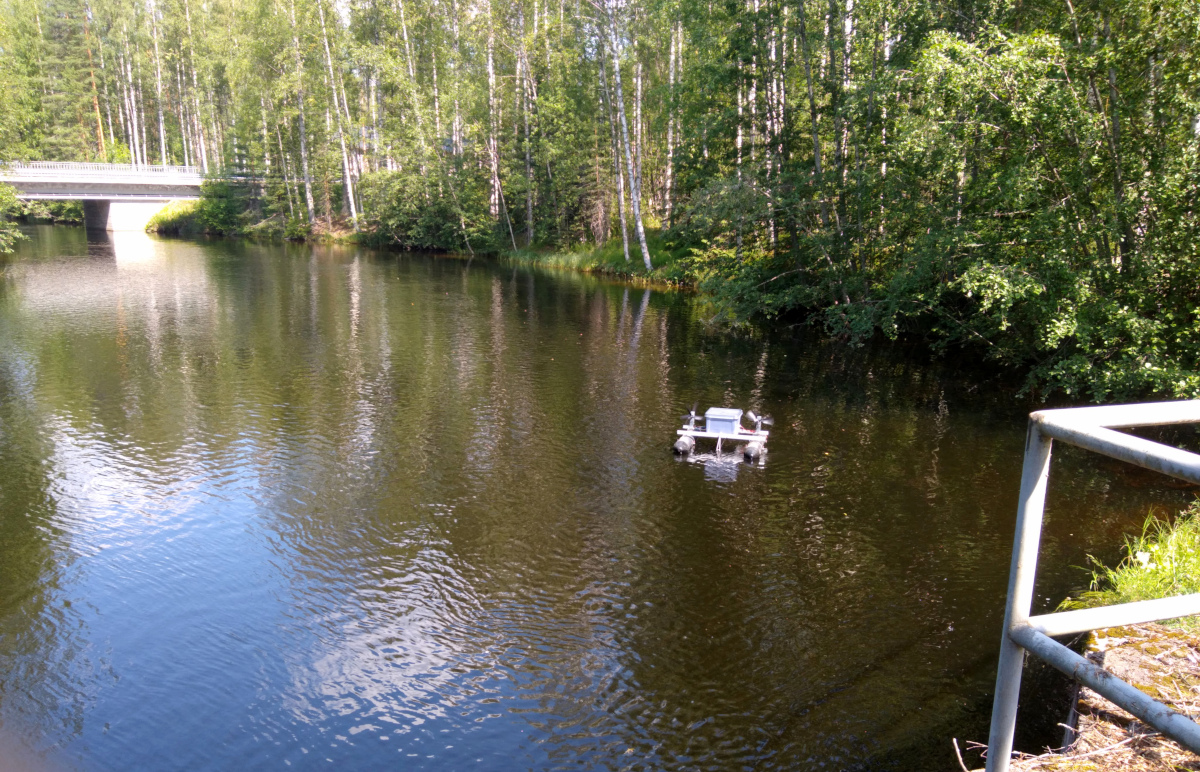 The RC-boat at work on the canal.
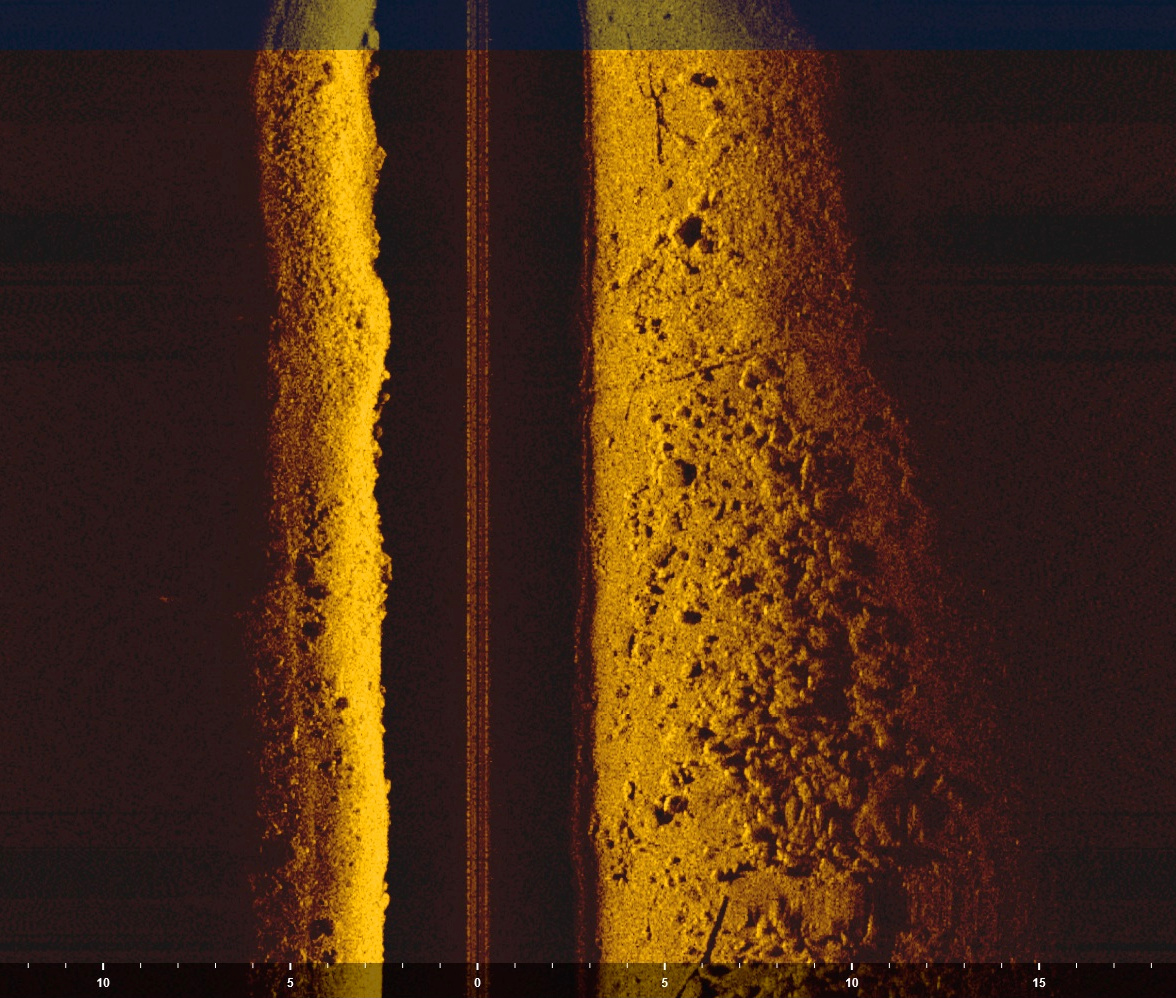 The canal was empty. Only rocks and small trees on the bottom.
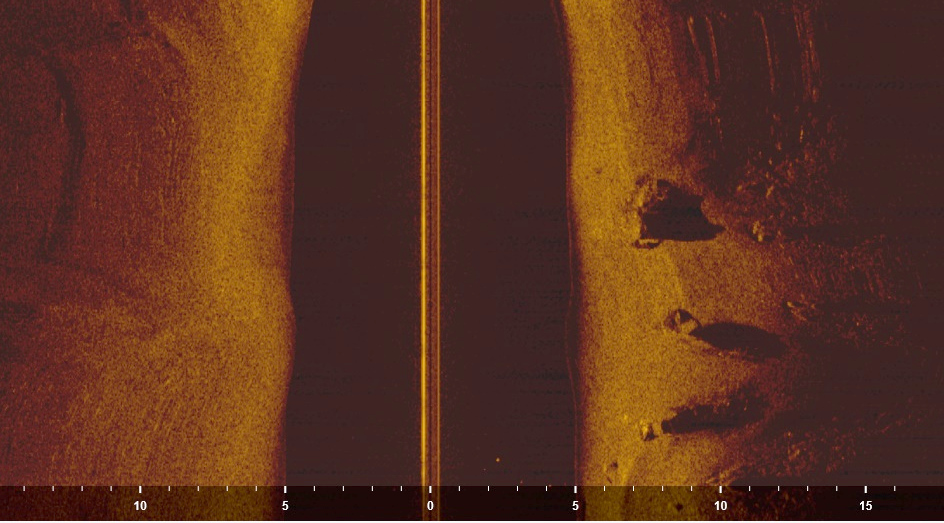 One of the clearer images. Shadow from tyres suggesting it might be a car. The river bottom otherwise smooth.
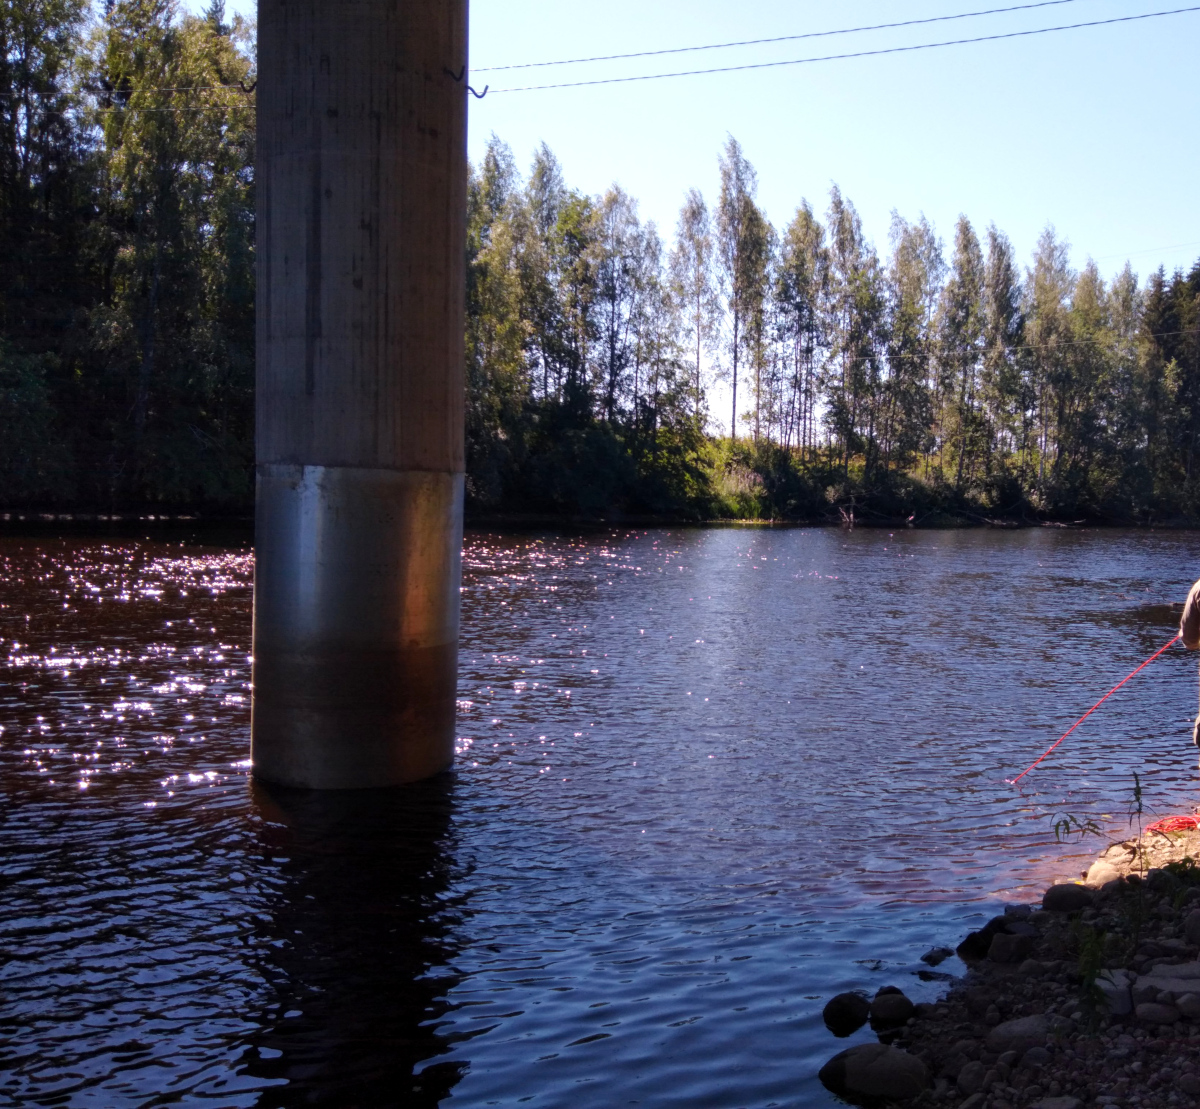 Reeling the magnet in.
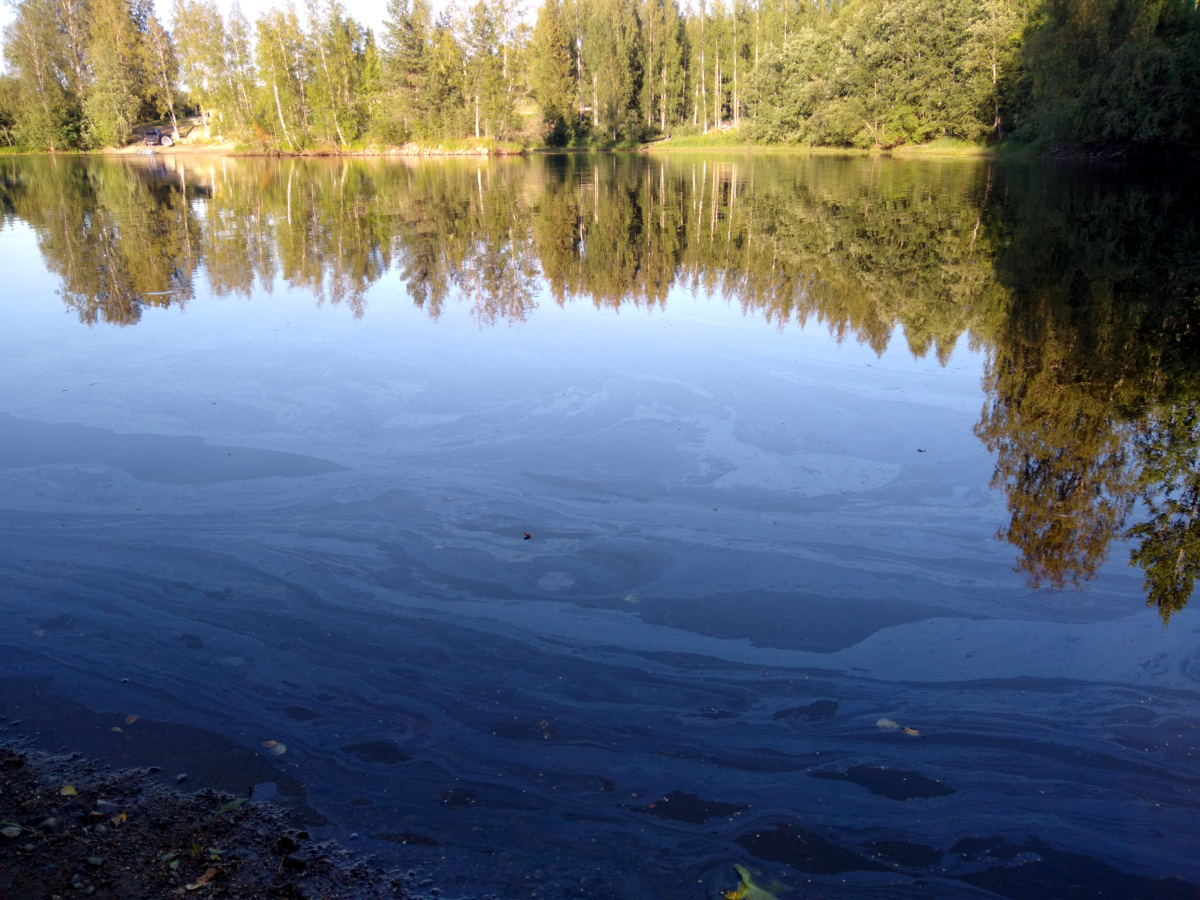 The picture doesn’t show the full extent but the whole river was covered with an oily substance, like benzine or diesel.
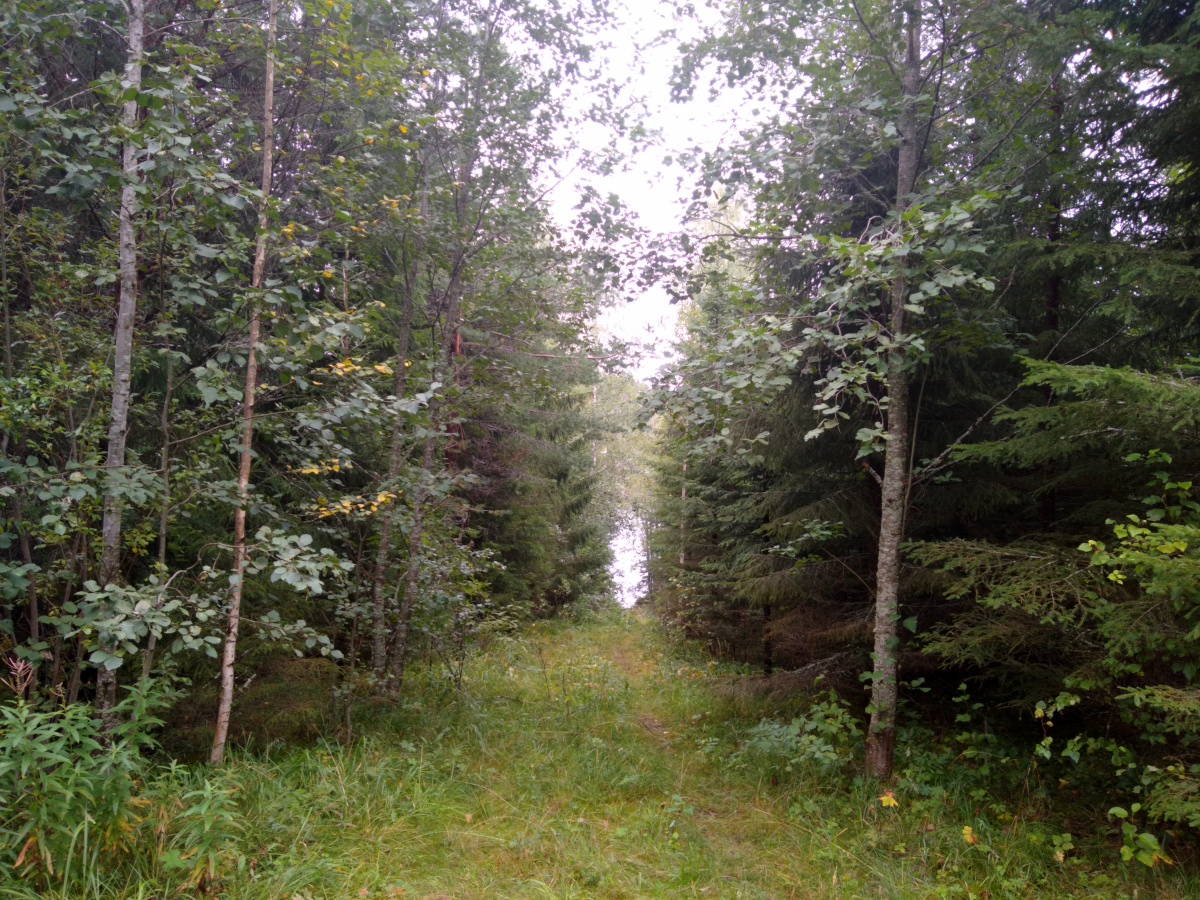 Spot 2 seen from the road.