The problem
As an Azure or Databricks admin, you sometimes need to create Azure Databricks workspaces. You don’t want do it from the portal everytime, as it does not scale. The answer is to use ARM templates, or Bicep. You create the resources through the portal, enable workspace logging from Diagnostic Settings, and export the resource ARM-template. Then you notice, the diagnostic settings are not included in the template. What to do?
Template for Diagnostic Settings
You can find templates for diagnostic settings from the Azure documentation. Now you have the basic template but what are the categories for logs in the Azure Databricks resource? There is a reference guide for logging but the categories, or service names as they are on the page, are not all documented and their names are not the same as in the diagnostic settings. Where can you find the category names?
Finding the category info
In the Azure portal, add a diagnostic setting for the Azure Databricks Workspace resource, and click the ‘JSON view’ link. The panel that opens up, contains the category settings in JSON which you combine to the template.
Here are all the current categories listed as a Bicep array:
var dg_setting_categories = [
  {
    category: 'dbfs'
    enabled: true
  }
  {
    category: 'clusters'
    enabled: true
  }
  {
    category: 'accounts'
    enabled: true
  }
  {
    category: 'jobs'
    enabled: true
  }
  {
    category: 'notebook'
    enabled: true
  }
  {
    category: 'ssh'
    enabled: true
  }
  {
    category: 'workspace'
    enabled: true
  }
  {
    category: 'secrets'
    enabled: true
  }
  {
    category: 'sqlPermissions'
    enabled: true
  }
  {
    category: 'instancePools'
    enabled: true
  }
  {
    category: 'sqlAnalytics'
    enabled: true
  }
  {
    category: 'genie'
    enabled: false
  }
  {
    category: 'globalInitScripts'
    enabled: true
  }
  {
    category: 'iamRole'
    enabled: true
  }
  {
    category: 'mlflowExperiment'
    enabled: false
  }
  {
    category: 'featureStore'
    enabled: false
  }
  {
    category: 'RemoteHistoryService'
    enabled: false
  }
  {
    category: 'mlflowAcledArtifact'
    enabled: false
  }
  {
    category: 'databrickssql'
    enabled: true
  }
  {
    category: 'deltaPipelines'
    enabled: true
  }
  {
    category: 'modelRegistry'
    enabled: false
  }
  {
    category: 'repos'
    enabled: true
  }
  {
    category: 'unityCatalog'
    enabled: true
  }
  {
    category: 'gitCredentials'
    enabled: true
  }
  {
    category: 'webTerminal'
    enabled: true
  }
  {
    category: 'serverlessRealTimeInference'
    enabled: true
  }
  {
    category: 'clusterLibraries'
    enabled: true
  }
  {
    category: 'partnerHub'
    enabled: true
  }
  {
    category: 'clamAVScan'
    enabled: true
  }
  {
    category: 'capsule8Dataplane'
    enabled: true
  }
  {
    category: 'BrickStoreHttpGateway'
    enabled: true
  }
  {
    category: 'Dashboards'
    enabled: true
  }
  {
    category: 'CloudStorageMetadata'
    enabled: true
  }
  {
    category: 'PredictiveOptimization'
    enabled: true
  }
  {
    category: 'DataMonitoring'
    enabled: true
  }
  {
    category: 'Ingestion'
    enabled: true
  }
  {
    category: 'MarketplaceConsumer'
    enabled: true
  }
  {
    category: 'LineageTracking'
    enabled: true
  }
]
And here is an example of a diagnostic setting configuration using a for-loop. Note that the scope has to be your Databricks workspace resource. This example sends the logs to a storage account.
resource setting 'Microsoft.Insights/diagnosticSettings@2021-05-01-preview' = {
  name: 'dg-databricks-logs'
  scope: dbw_databricks_workspace
  properties: {
    storageAccountId: st_databricks_logs.id
    logs: [ for cat in dg_setting_categories: {
        category: cat.category
        enabled: cat.enabled
        retentionPolicy: {
          days: 0
          enabled: false
        }
      }
    ]
    metrics: []
  }
}
If you want to enable all the logs, you can just use the categoryGroup. Here’s an example
{
    "category": null,
    "categoryGroup": "allLogs",
    "enabled": true,
    "retentionPolicy": {
        "days": 0,
        "enabled": false
    }
}
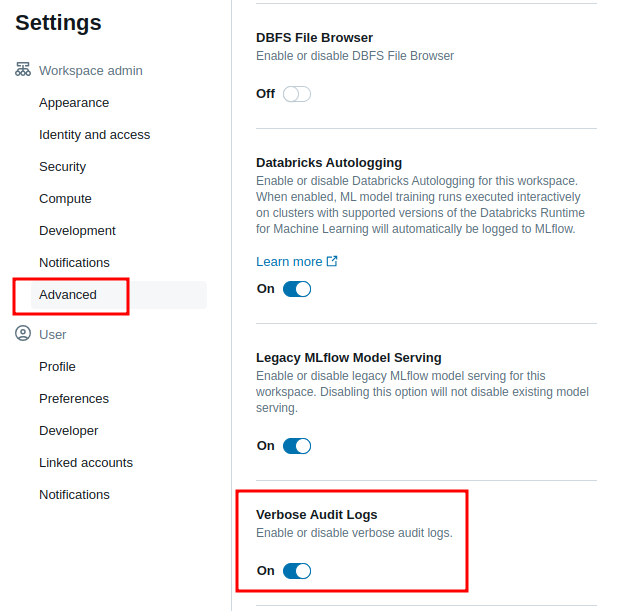
User query logging
One thing to keep in mind is that if you need to log the user SQL-queries and other commands, enabling the SQL-categories from diagnostic settings is not enough. You need to enable verbose audit logs from the workspace settings.
You might to want to do it using the Databricks REST API or Databricks CLI. Using these tools, what is the setting name? Fortunately, someone has documented it.
Here is how you can query and enable the verbose logging using the Databricks CLI.
$ databricks workspace-conf get-status enableVerboseAuditLogs
$ databricks workspace-conf set-status --json '{ "enableVerboseAuditLogs": "true" }'
One more thing to note. If logging user queries is required for compliance, you might need to send the logs to a Log Analytics workspace and create an alert for any changes in the verbose logging.